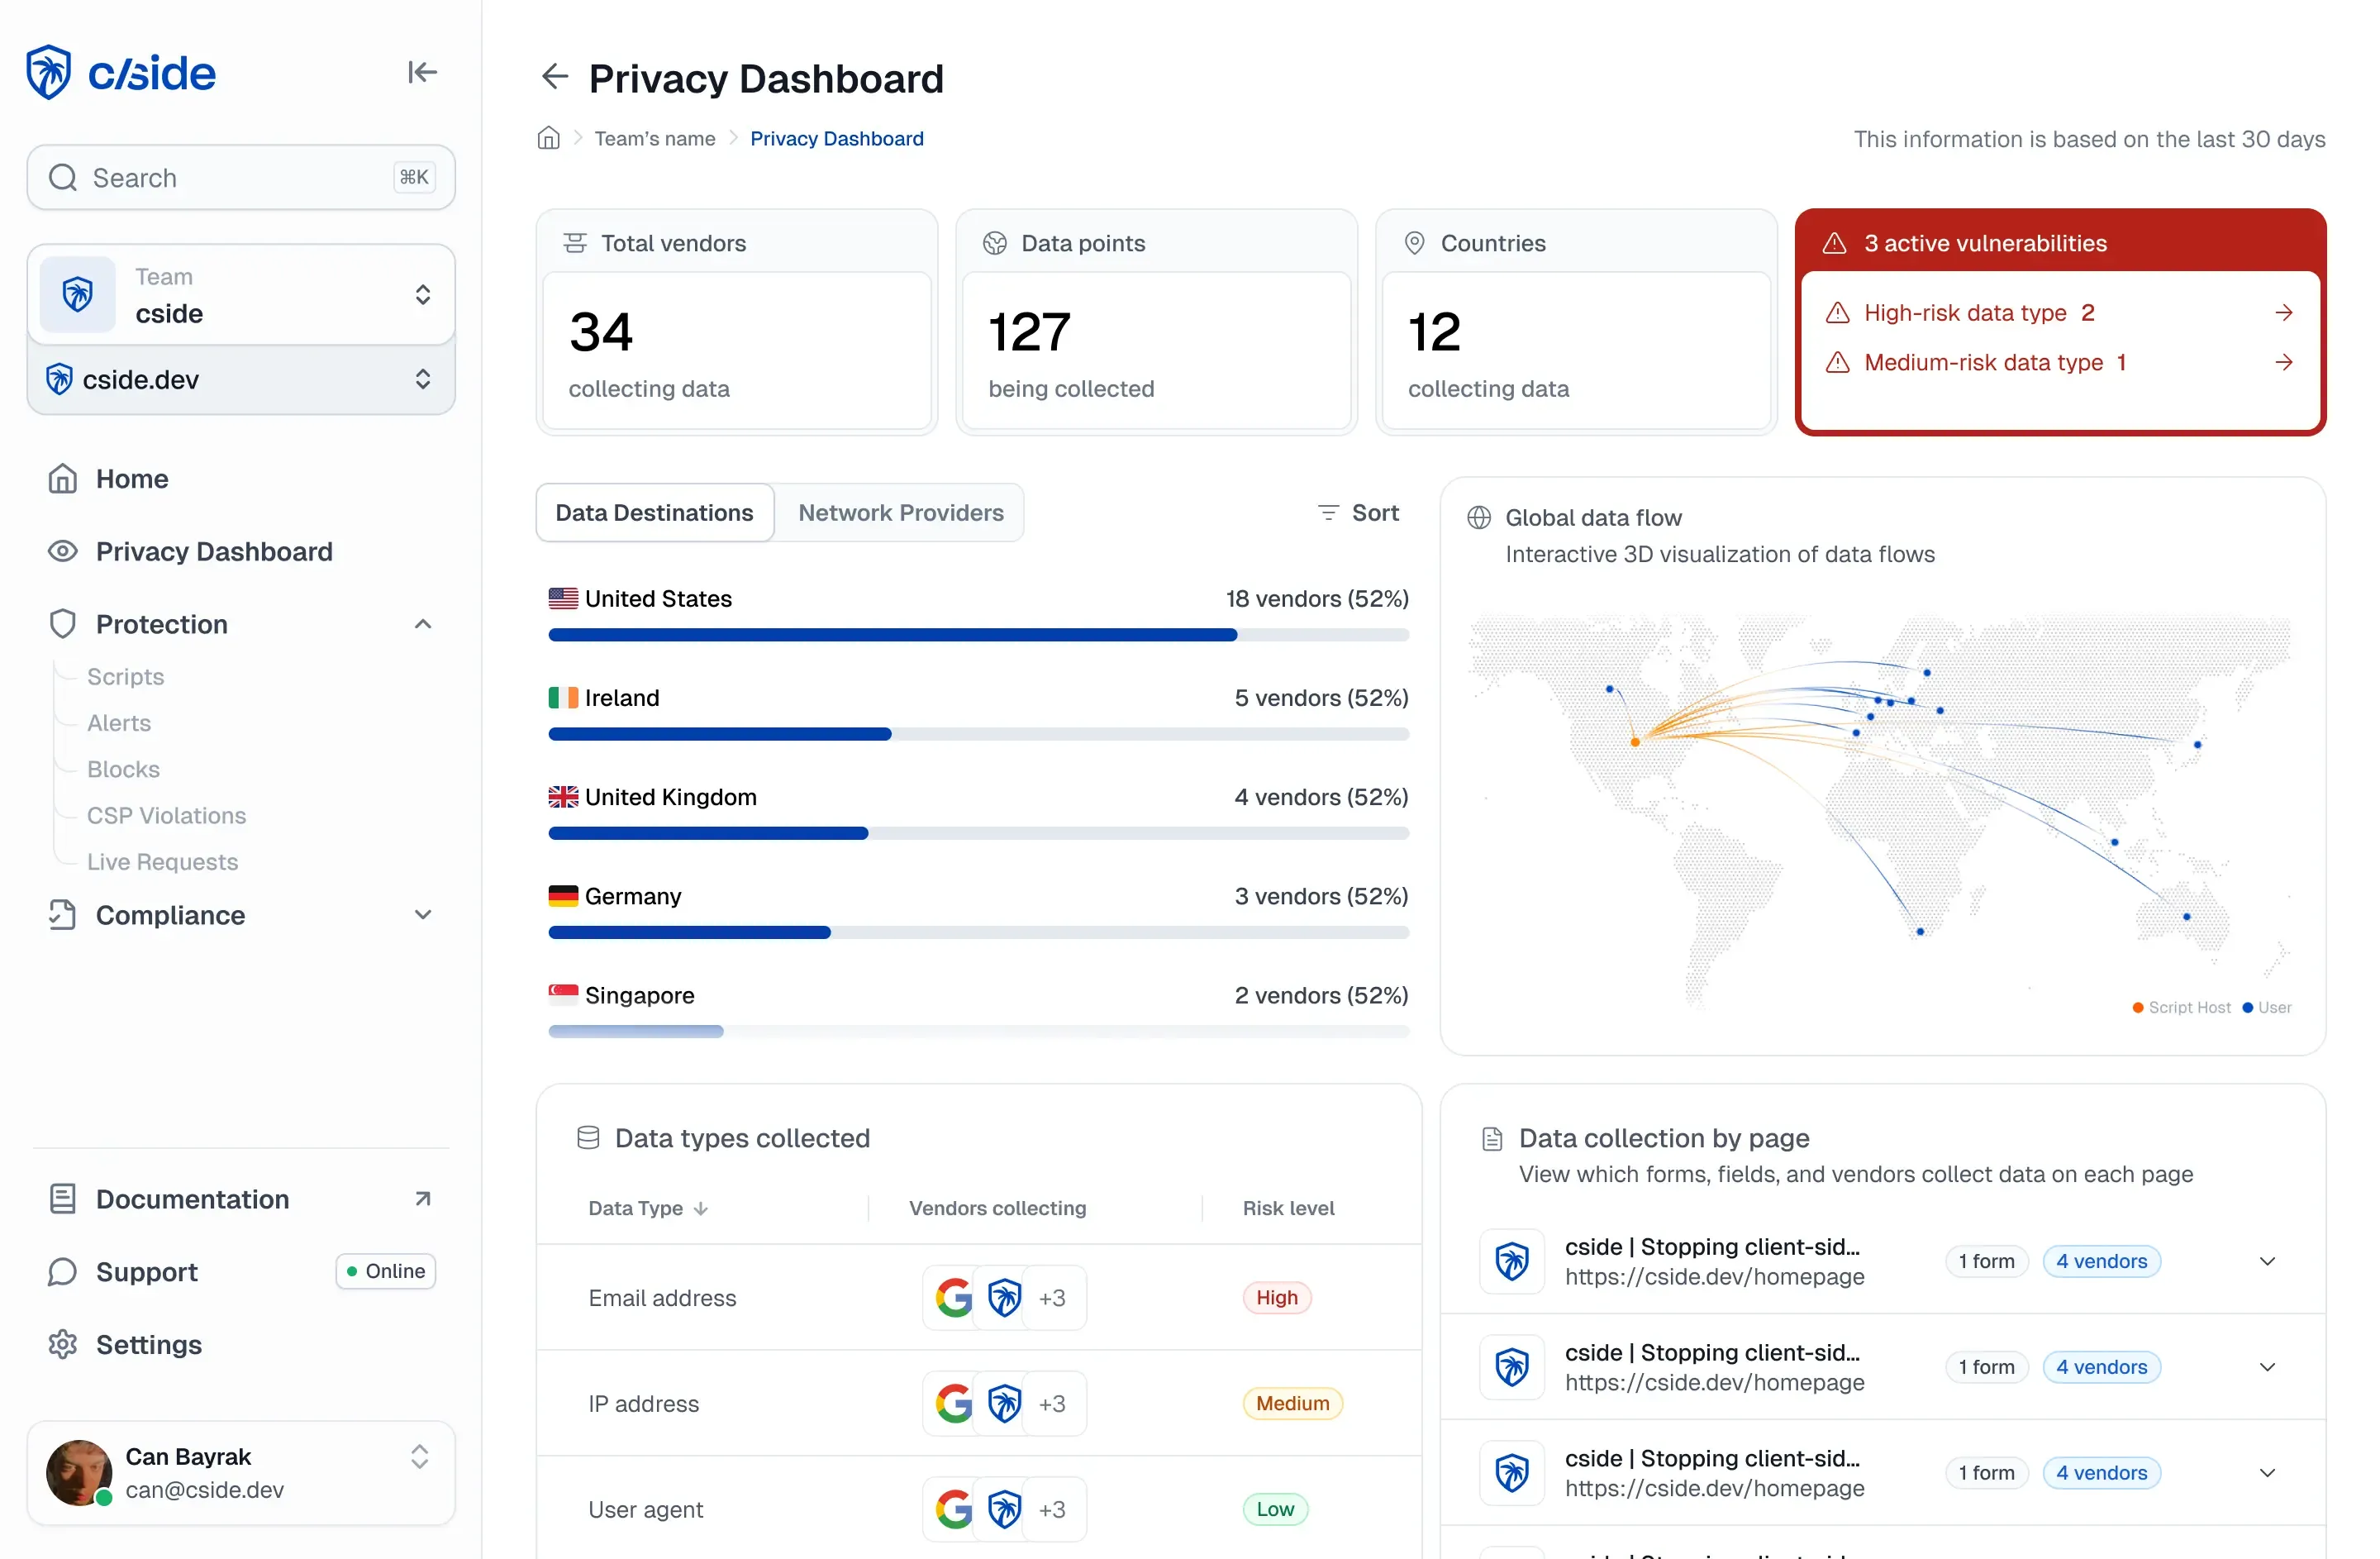

TL;DR: browser runtime script activity log for Magecart incident response
- Your stack can't see it: Security teams brag about their SIEM, EDR, and WAF coverage, then a Magecart script reads a card field and posts it out over HTTPS, and every one of those tools writes a clean log line. The browser runtime is the layer they were never designed to see.
- A browser-native activity log: The Polyfill[.]io compromise in June 2024 modified one widely used CDN-hosted script to serve malicious payloads to over 490,000 websites, and cside's browser-native script activity log records DOM reads, network destinations, cookie access, dynamic script injection, subresource chains, and baseline deviations for every real user session.
- Instrument before the breach: If your only detection path for a supply-chain compromise is a breach notification from a third party, your Article 33 clock has already started. Instrument the browser runtime, or keep an incident-response plan that assumes every session was compromised because the log to prove otherwise never existed.
Short on time? See cside's in-browser Magecart and skimmer blocking. It covers everything below in one deployment.
Browser-layer script activity logging is the real-time recording of what JavaScript executes inside a user's browser: every DOM read, form field access, network request, cookie write, and dynamic script injection made by first- and third-party code during a live session. It is the logging layer that SIEM, EDR, and WAF tools cannot reach, and where Magecart skimming, supply-chain compromises, and session-hijacking scripts execute.
Most security teams have strong logging at the server, network, and endpoint layers. The browser runtime, where third-party scripts run with the same privileges as first-party code, is almost always unmonitored. This guide covers what a browser script activity log captures, why the gap matters, and what effective incident response looks like when a script on your site is compromised.
The logging gap most stacks leave open
A typical enterprise security stack logs the following layers:
| Layer | What it logs | Typical tools |
|---|---|---|
| Network | HTTP/S traffic, DNS, firewall events | WAF, NGFW, NDR |
| Endpoint | OS calls, process execution, file writes | EDR, XDR |
| Server | Application logs, auth events, API calls | SIEM (via agents/connectors) |
| Browser runtime | JavaScript execution, DOM reads, script behavior | Missing in most stacks |
The browser runtime is where client-side attacks operate. A Magecart script reads the value of a payment card field and sends it to a remote server. That read happens entirely inside the browser. The network layer sees an HTTPS POST after the data has already left. The EDR sees no anomalous process. The SIEM has no entry. The attack completes with a clean log record everywhere, which is why teams that want to detect Magecart in real time instrument the browser itself.
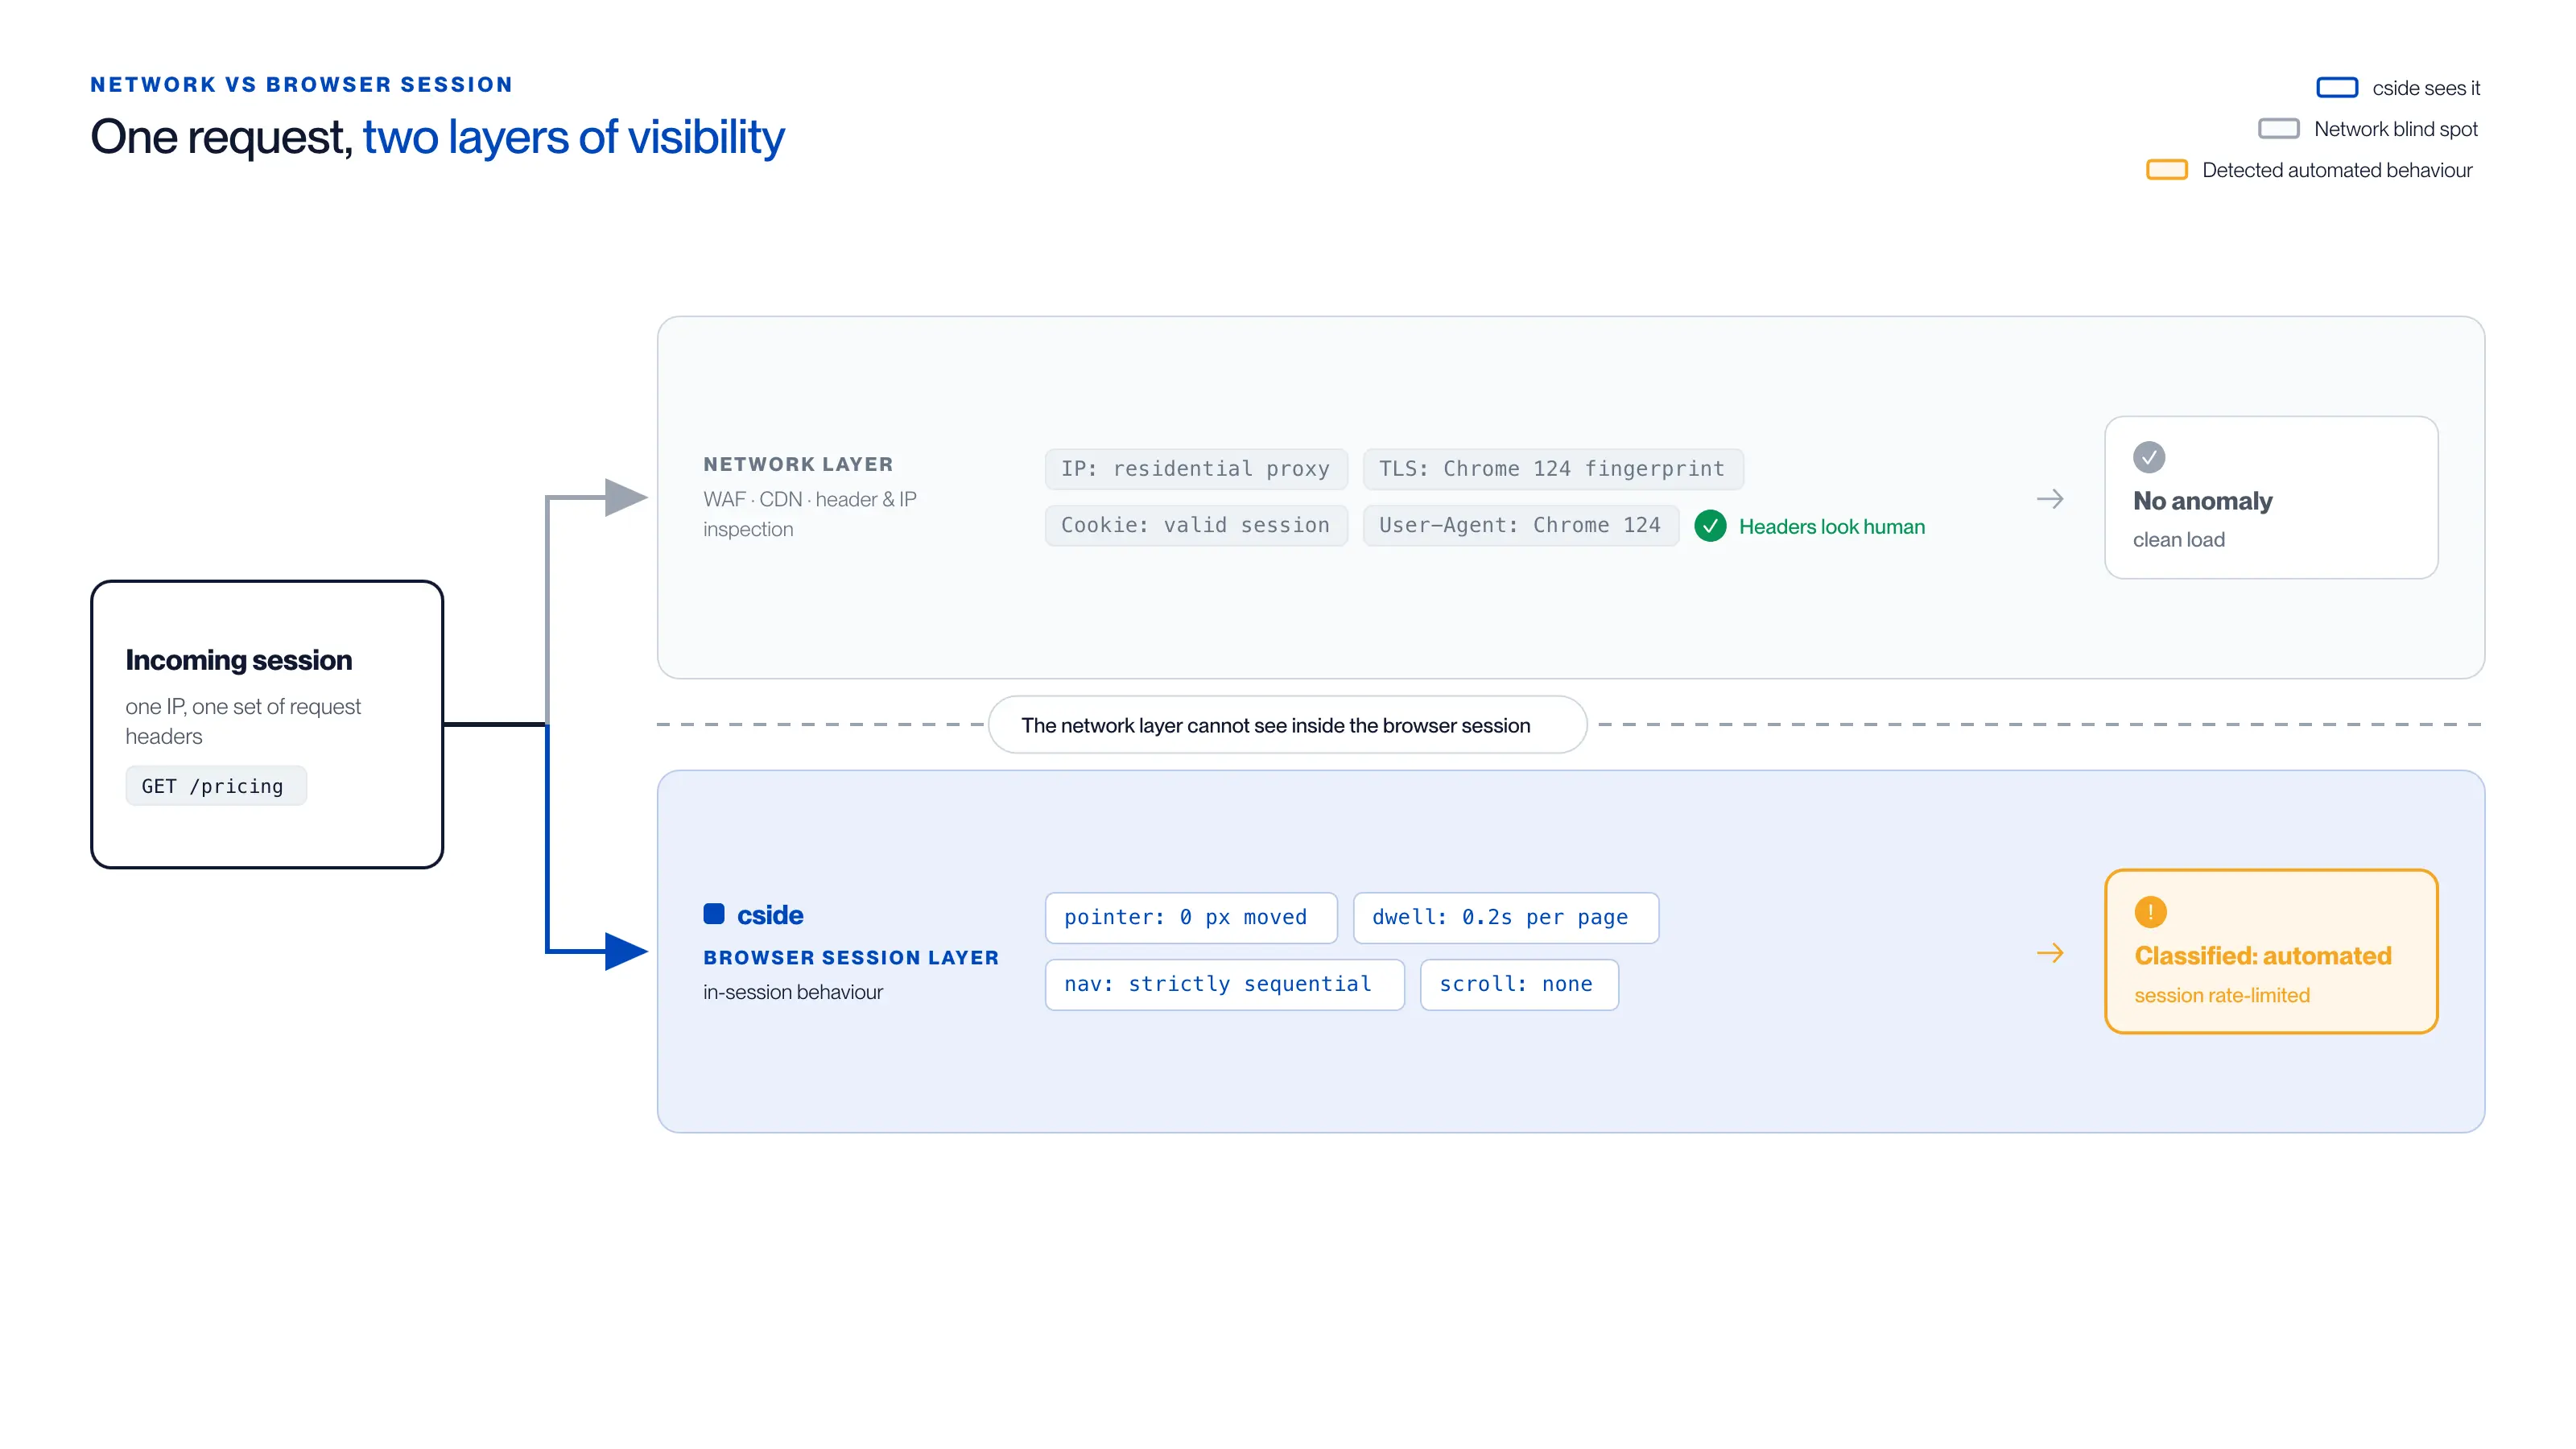
For one GET /pricing from a single IP, the two layers reach opposite verdicts:
| Network/server layer sees | Browser-session layer sees |
|---|---|
| IP: residential proxy | Pointer: 0 px moved |
| TLS: Chrome 124 fingerprint | Dwell: 0.2s per page |
| Cookie: valid session | Navigation: strictly sequential |
| User-Agent: Chrome 124 | Scroll: none |
| Verdict: no anomaly, clean load | Verdict: classified automated, session rate-limited |
The headers look human, so WAF, CDN, and IP inspection wave the request through. The same session, read at the browser layer, never moves a pointer, dwells 0.2 seconds per page, and walks pages in strict order without scrolling, the network blind spot is exactly where cside catches it.
The Polyfill[.]io supply-chain compromise in June 2024 demonstrated this at scale. A widely used CDN-hosted script was modified to serve malicious payloads to over 490,000 websites. Each affected site's WAF, SIEM, and EDR had clean logs. The only tools that could detect the anomaly were those operating at the browser execution layer.
What a complete browser script activity log captures
A useful browser-layer activity log records six categories of script behavior:
1. DOM access and mutation
Which elements a script reads or writes, with specific attention to input fields, form elements, and password fields. A payment-page script that has never previously read the card number field but does so in a new deployment is a behavioral anomaly worth flagging immediately.
2. Network requests
Every fetch(), XMLHttpRequest, navigator.sendBeacon(), image pixel, and WebSocket connection initiated by a script, including the destination domain, request method, and whether the destination is new or previously seen. New outbound destinations are the primary indicator of data exfiltration.
3. Cookie and storage access
Which scripts read or write cookies, localStorage, and sessionStorage. Legitimate analytics scripts rarely need session tokens. If one starts reading them, the behavior should be flagged.
4. Dynamic script injection
Scripts that create new <script> elements or use eval(), Function(), or document.write() to execute new code at runtime. This is how second-stage malware loads in supply-chain attacks: the first script is clean and it fetches and executes the actual payload dynamically.
5. Subresource requests and fourth-party dependencies
Scripts that load additional external resources, creating a chain from your approved third-party to an unapproved fourth-party domain. The Polyfill[.]io attack used this pattern: the compromised CDN script loaded attacker-controlled code from a separate domain.
6. Behavioral baseline deviations
The most actionable signal is not a single event but a deviation from established behavior. A script that has run on your checkout page for six months and has never accessed form fields, then suddenly starts reading card input values in one session per thousand: that is the detection event.
Incident response for browser script attacks
Effective incident response for a browser-layer script compromise follows a distinct workflow from server-side incidents. The timeline is compressed because data can be exfiltrated in milliseconds and the attack surface is every user session running the compromised script.
Detect
Detection relies on behavioral anomaly alerting, not signature matching. Signature-based detection fails against polymorphic and obfuscated payloads described in detail here. The trigger for a browser-layer incident should be: a known script accessing data types it has never previously accessed, or a script making network requests to a destination outside its established behavior profile.
A real-time alert, not a next-day SIEM batch, is the minimum standard. By the time a daily log review catches a Magecart script, tens of thousands of sessions may have been exposed.
Contain
Containment at the browser layer happens differently from endpoint containment. Options include:
- Block the specific network request: prevent the exfiltration call from completing by intercepting the outbound request the malicious script makes.
- Block the script itself: prevent the compromised script from loading on subsequent page loads, immediately reducing the attack surface.
- Alert without blocking: use for lower-confidence detections where false-positive risk is high. Logs the event and alerts the team without user-visible impact.
The ability to block without a code deployment, directly from a monitoring platform without touching the site's source, is critical for speed of containment. Code deployments take hours; browser-layer blocking can be near-instantaneous.
Investigate
The investigation step requires a log of what happened in affected sessions. Without a browser activity log, this step is nearly impossible. With one, the investigation can answer:
- Which sessions ran the compromised script version?
- During those sessions, which data fields did the script access?
- Where were the network requests sent?
- Did the exfiltration complete (did the destination respond) or was it interrupted?
This log is also the evidentiary record for breach notification decisions under GDPR Article 33 (72-hour notification threshold) and PCI DSS requirements. Without it, the default assumption under most frameworks is that all exposed sessions were compromised.
Remediate
Remediation for a browser script compromise includes: removing or rolling back the compromised script version, confirming the attacker's exfiltration endpoint is blocked at the network level, assessing which user sessions require notification, and updating the script's behavioral baseline so the next deviation is detected faster.
The post-incident review should assess whether the detection-to-containment window met an acceptable threshold. For payment-page scripts under PCI DSS requirements 6.4.3 and 11.6.1, the expectation is detection of unauthorized script modifications in real time, not hours or days later.
How to evaluate platforms for browser script activity logging
Not all monitoring tools that claim browser-layer visibility actually instrument the browser runtime. Questions to ask during a product evaluation:
| Evaluation area | What to look for | Red flag |
|---|---|---|
| Logging method | Agent or SDK that runs in the browser and observes execution | Crawler that simulates sessions externally |
| Coverage | All sessions, not a sampled subset | Sampling means most attacks go unlogged |
| Baseline learning | Automatic behavioral profiling per script per page | Requires manual threshold configuration |
| Blocking capability | Can block script network requests without a code deployment | Detection-only with no enforcement path |
| Log retention | Indexed session-level logs available for investigation | Aggregate metrics only, no session replay |
| Compliance evidence | Exportable logs mapped to PCI DSS 6.4.3/11.6.1 and GDPR Article 32 | No structured compliance output |
The key distinction is instrumentation method. An external scanner visits your page from a headless browser and records what it observes during that artificial session. An attacker who only activates against real users, a common evasion technique, is invisible to a scanner. Runtime instrumentation that runs in every real user's session captures what scanners miss.
Where cside fits
cside is browser-native script activity logging and enforcement built specifically for third-party JavaScript risk. It instruments the browser execution layer in every real user session and logs the six categories described above: DOM access, network requests, cookie and storage reads, dynamic script injection, subresource chains, and behavioral deviations from established baselines.
When an anomaly is detected, cside can block the script's network requests or the script itself without requiring a code deployment. The activity log it produces is structured for both incident investigation and compliance evidence under PCI DSS 6.4.3, 11.6.1, and GDPR Article 32.
For teams currently relying on SIEM, EDR, and WAF coverage and assuming those three layers cover the full attack surface: they do not cover the browser runtime. That is the layer where Magecart, formjacking, and digital skimming, supply-chain compromises, and session-hijacking scripts operate, and it is the layer where script activity logging and incident response has the widest gap in most enterprise stacks.